
As a systems thinker and someone with coding chops, I love to use data visualization to understand complex systems. Giving people a visceral feeling for their data engages the intuition, inspires creativity, and help us get to action more quickly.
This is a showcase of some of the visualizations I have created over the years as I’ve worked on issues from carbon emissions reductions, to zero waste cities, over-fishing and mapping social entrepreneurship ecosystems.
Social Entrepreneurship Ecosystem
These visuals evaluate the formation and strengthening of relationships over time, as local social innovators participated in a fellowship to develop their network. Visuals emphasize the strengthening and densification of connections in the network.

Social network graphs provoke a strong, visceral sense of the dynamics of a network. A lot of information can be packed-in by making strategic use of edge weight, symbol shape, and colour. The small box in the bottom right shows the larger universe of unconnected nodes. I use Kumu.io to produce these with ease.
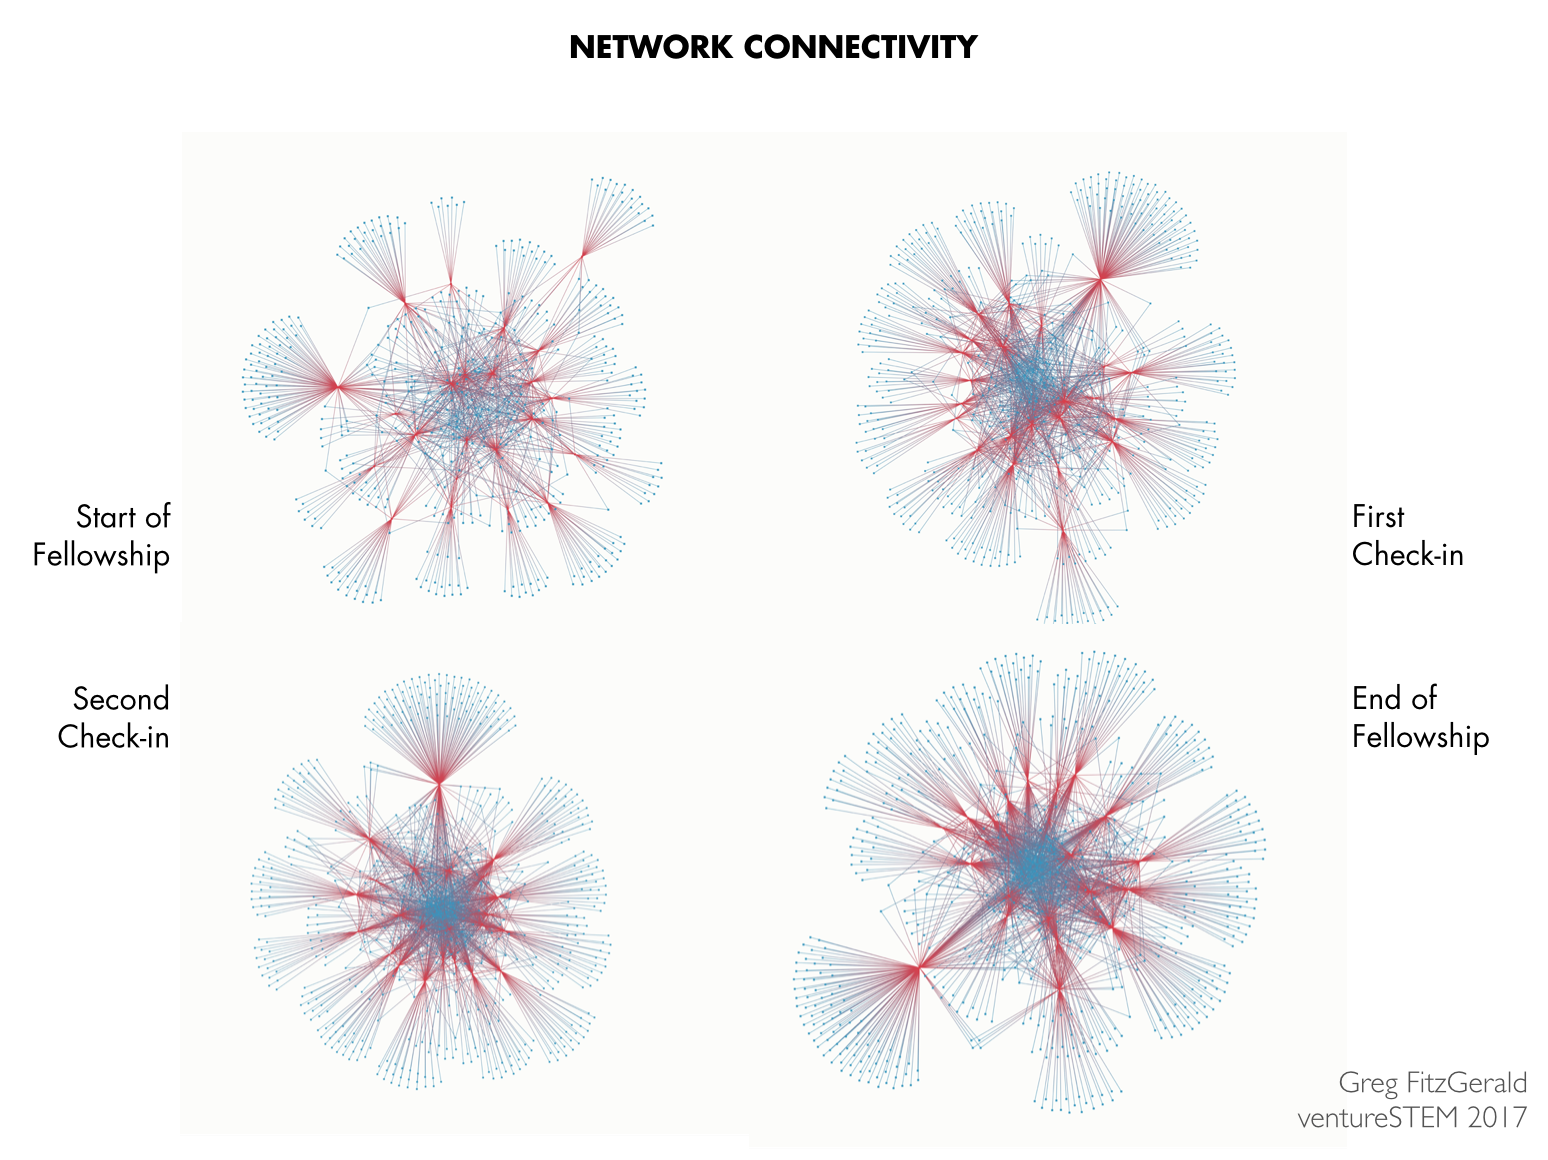
See how the network evolves over time. Notice offshoots which represent a person’s exclusive network. Connection density increases as fellows form stronger relationships, and become bridges to influential organizations in the local ecosystem.

The width of bars in this chord diagram equalize as fellows with weak networks gain new connections. Chord diagram was adapted from Pasha’s example posted to the D3 Gallery here.

Circle packing emphasizes connection strength. Strongly connected organizations have larger bubbles (which in turn inherit their size from the number and strength of fellows to which they are connected). Circle pack was adapted from Mike Bostock’s example in the D3 Gallery here.
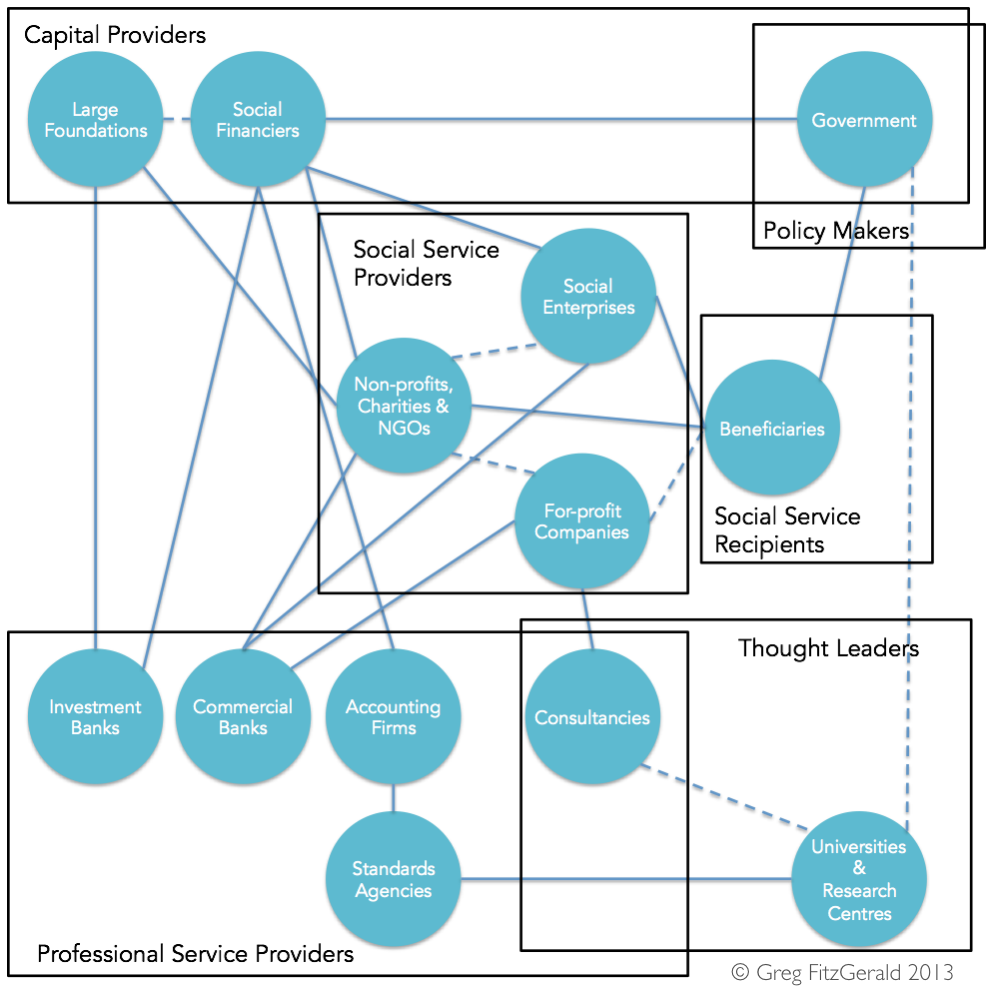
Here’s a much earlier rendition I created of the social innovation ecosystem showing weak and strong ties, and stakeholder domains in gold old-fashioned PowerPoint.
Carbon Emissions Intensity
I spend a lot of my time developing frameworks to encompass systemic data. These treemaps from Carbon Analytics show the distribution of supply chain carbon emissions for a utility organization across categories of suppliers, and can be resized by total emissions, total spend, and number of suppliers.

When organized by carbon emissions, the bulk of emissions clearly come from electricity generation.
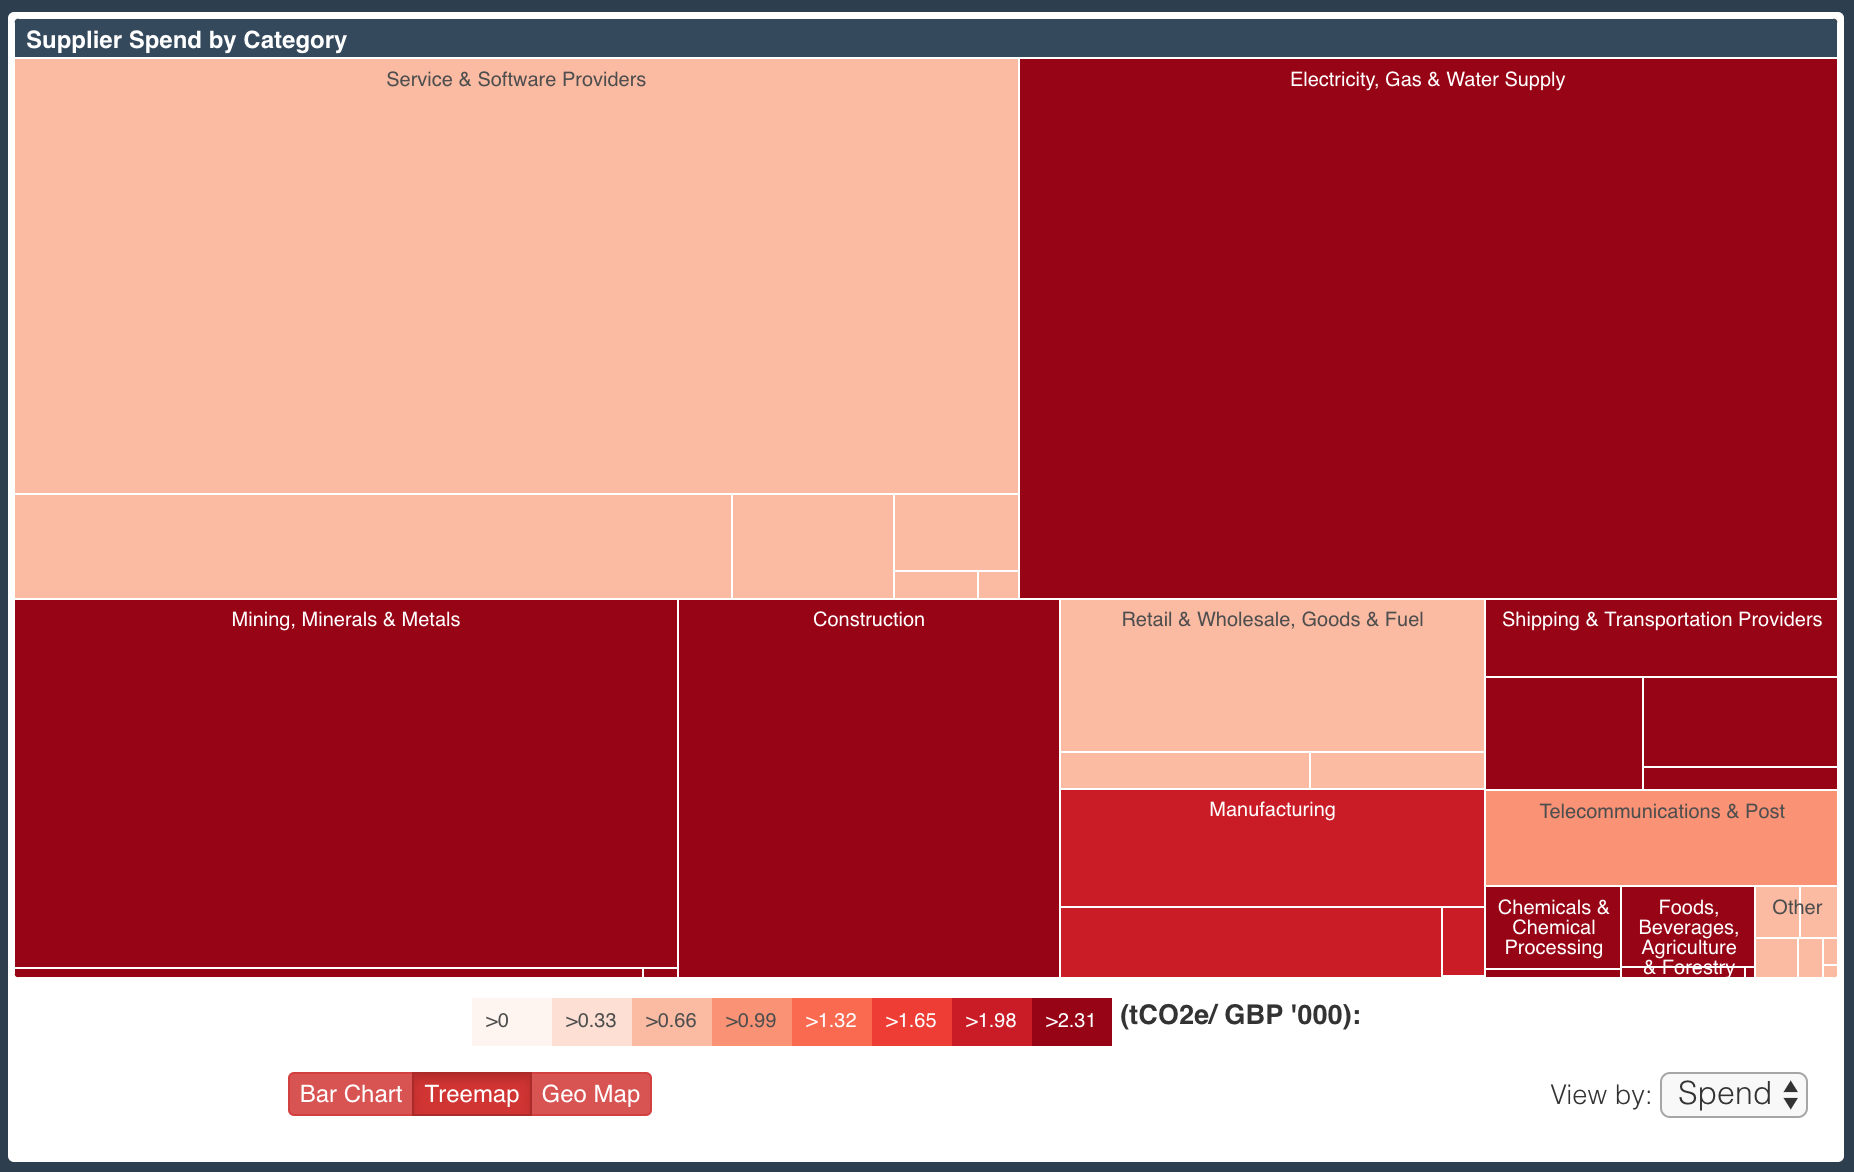
By contrast, electricity generation is a very small category of spend.

And represents an even smaller set of suppliers.
This can help strategically target outsized contributors of carbon emissions in the supply chain to make substantial impact on carbon efficiency. In the live visual, clicking on a category expands the rectangle to view the suppliers within.
Understanding Municipal Waste
I’ve looked at waste in a few ways, including prospecting for it with Terra Recovery. These visuals, created during a hackathon I participated in, showcase the distribution of Vancouver waste by material composition, and by region. The waste composition data is real, however the regional distribution was a proof of concept with dummy data only.
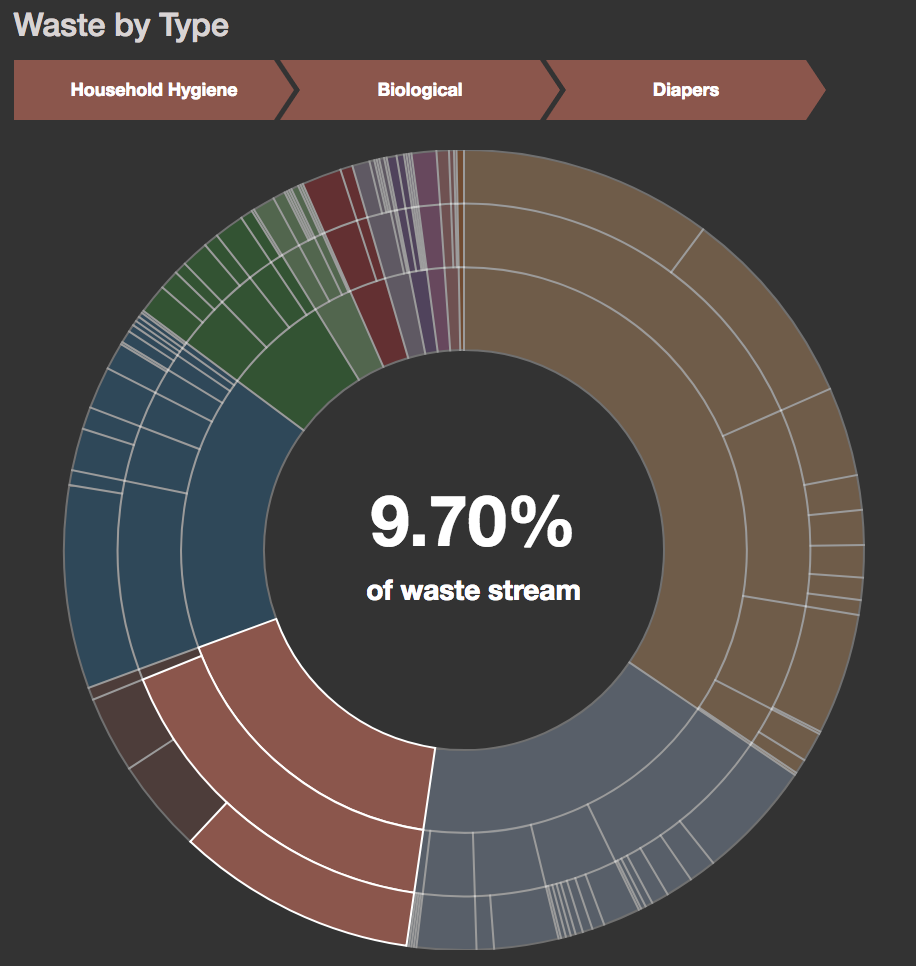
The sunburst visual provides an interactive wheel to explore categories and sub-categories of the Vancouver waste stream. That’s a lot of diapers! Sunburst template was adapted from an example posted by Kerry Rodden to the D3 Gallery here.

Choropleths show waste intensity by neighbourhood (this is just a mock-up, before all those folks out near UBC get too up in arms). Mapbox and OpenStreetMap are hard at work powering my geographic visuals.
Causal Loops in Over-fishing
More of a systems tool than a data visualization, I use causal loops to identify drivers of chronic issues, intervention points, and potential repercussions. In this example it is not desirable to break the drivers of demand for seafood, so we focus on the behaviour driven by demand (right side).

Desired and unintended outcomes are mapped to see the second-order consequences of intervention, where greater uncertainty must be managed.

Behind the visuals – Open Data
In 2012, I co-authored the Concept of Operations for the “DataBC” Open Data portal of the Government of British Columbia. Open Data is an immensely important service that governments can provide to spur data-driven innovation. In this document we compare the provision of data by governments to a utilities like electricity and water. Check it out here.

DataBC Concept of Operations
More visuals
I’ll keep this page updated with new visualizations as they come about. Interested to work together on a data visualization project? Email me at hello [at] gregfitzgerald.ca